This is a Grafana data source plugin built for GreptimeDB. This plugin is built on top of original Grafana Prometheus data source and enhanced for GreptimeDB's additional features.
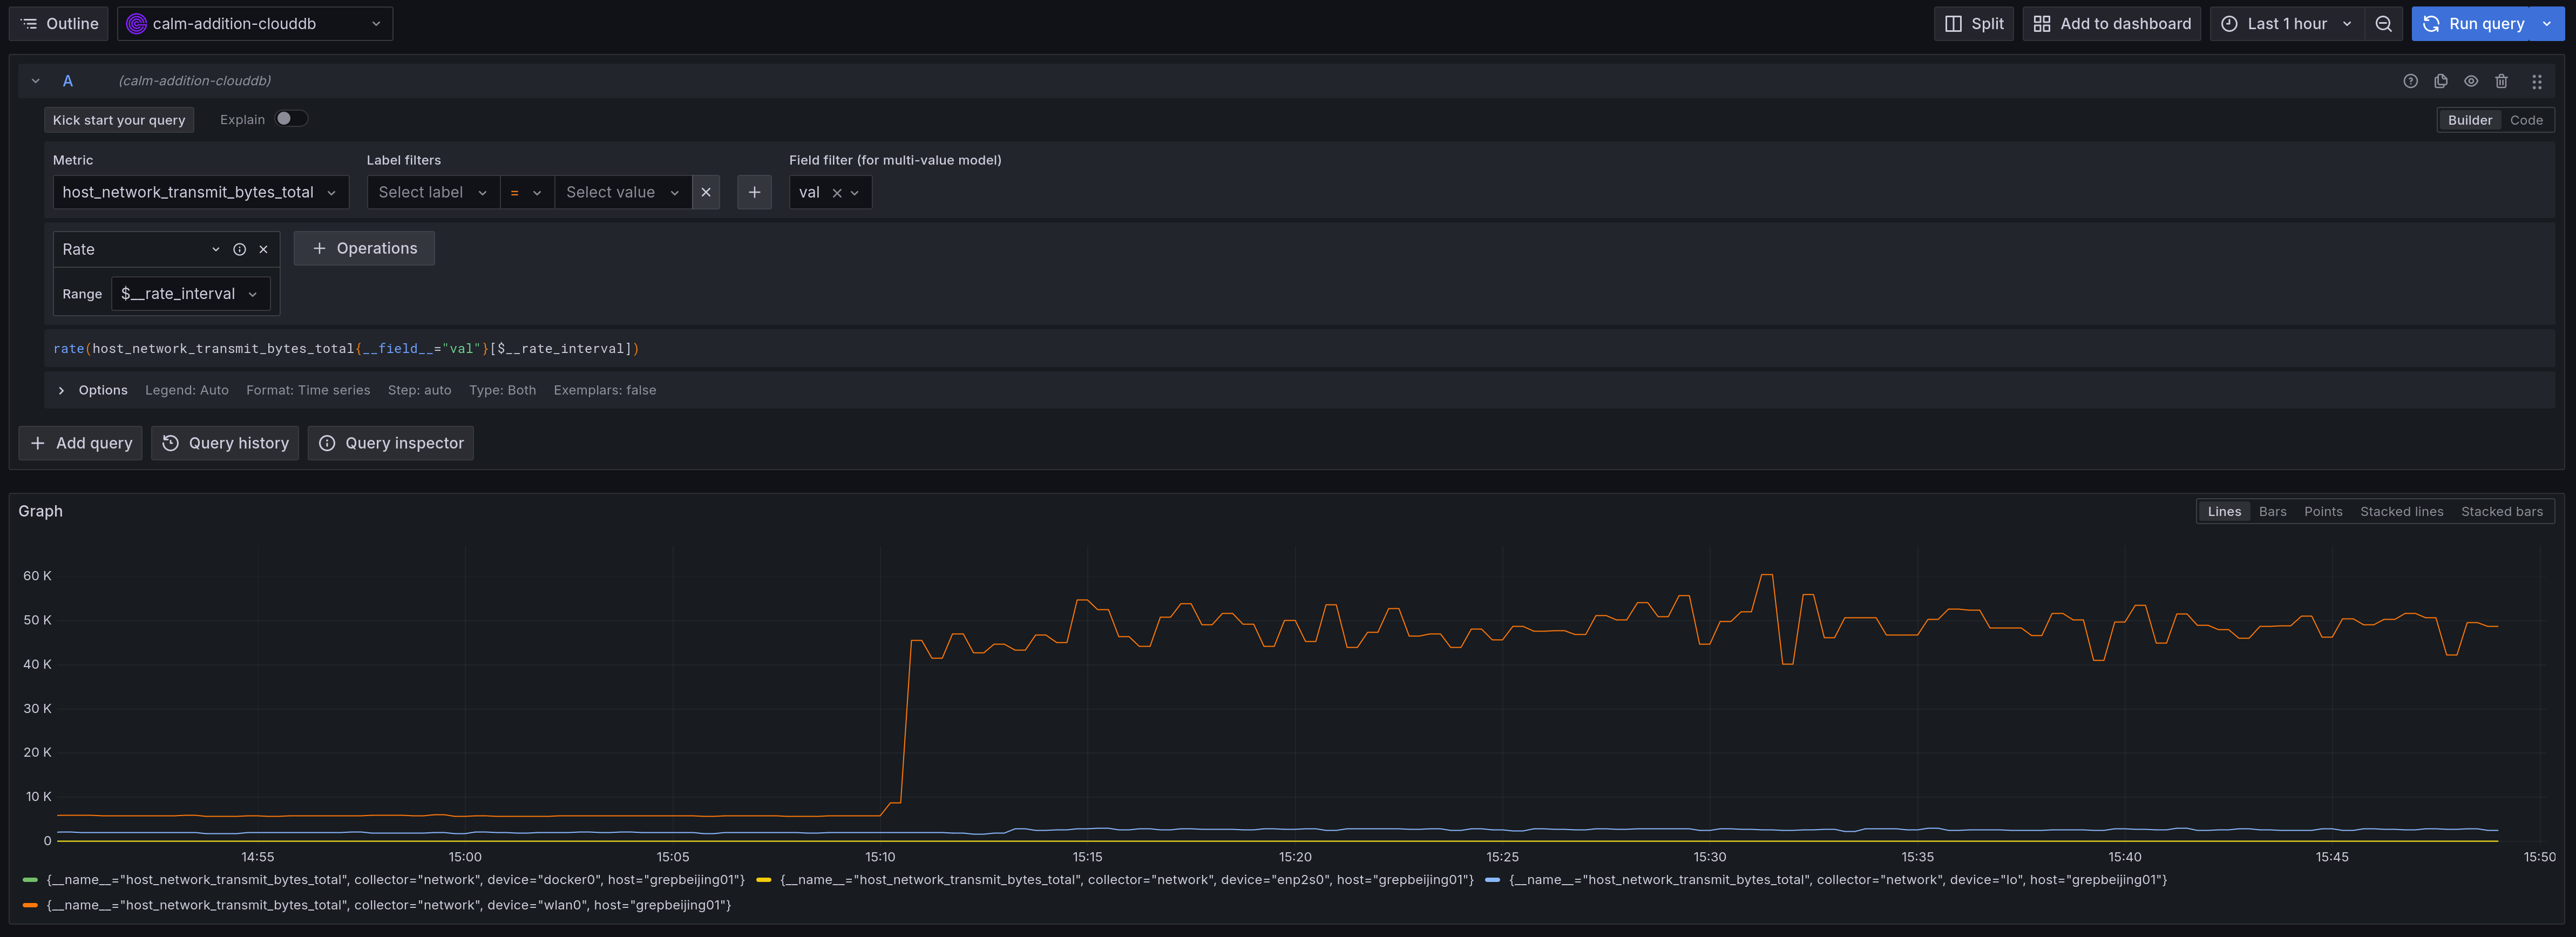
PromQL query builder with additional field selector.
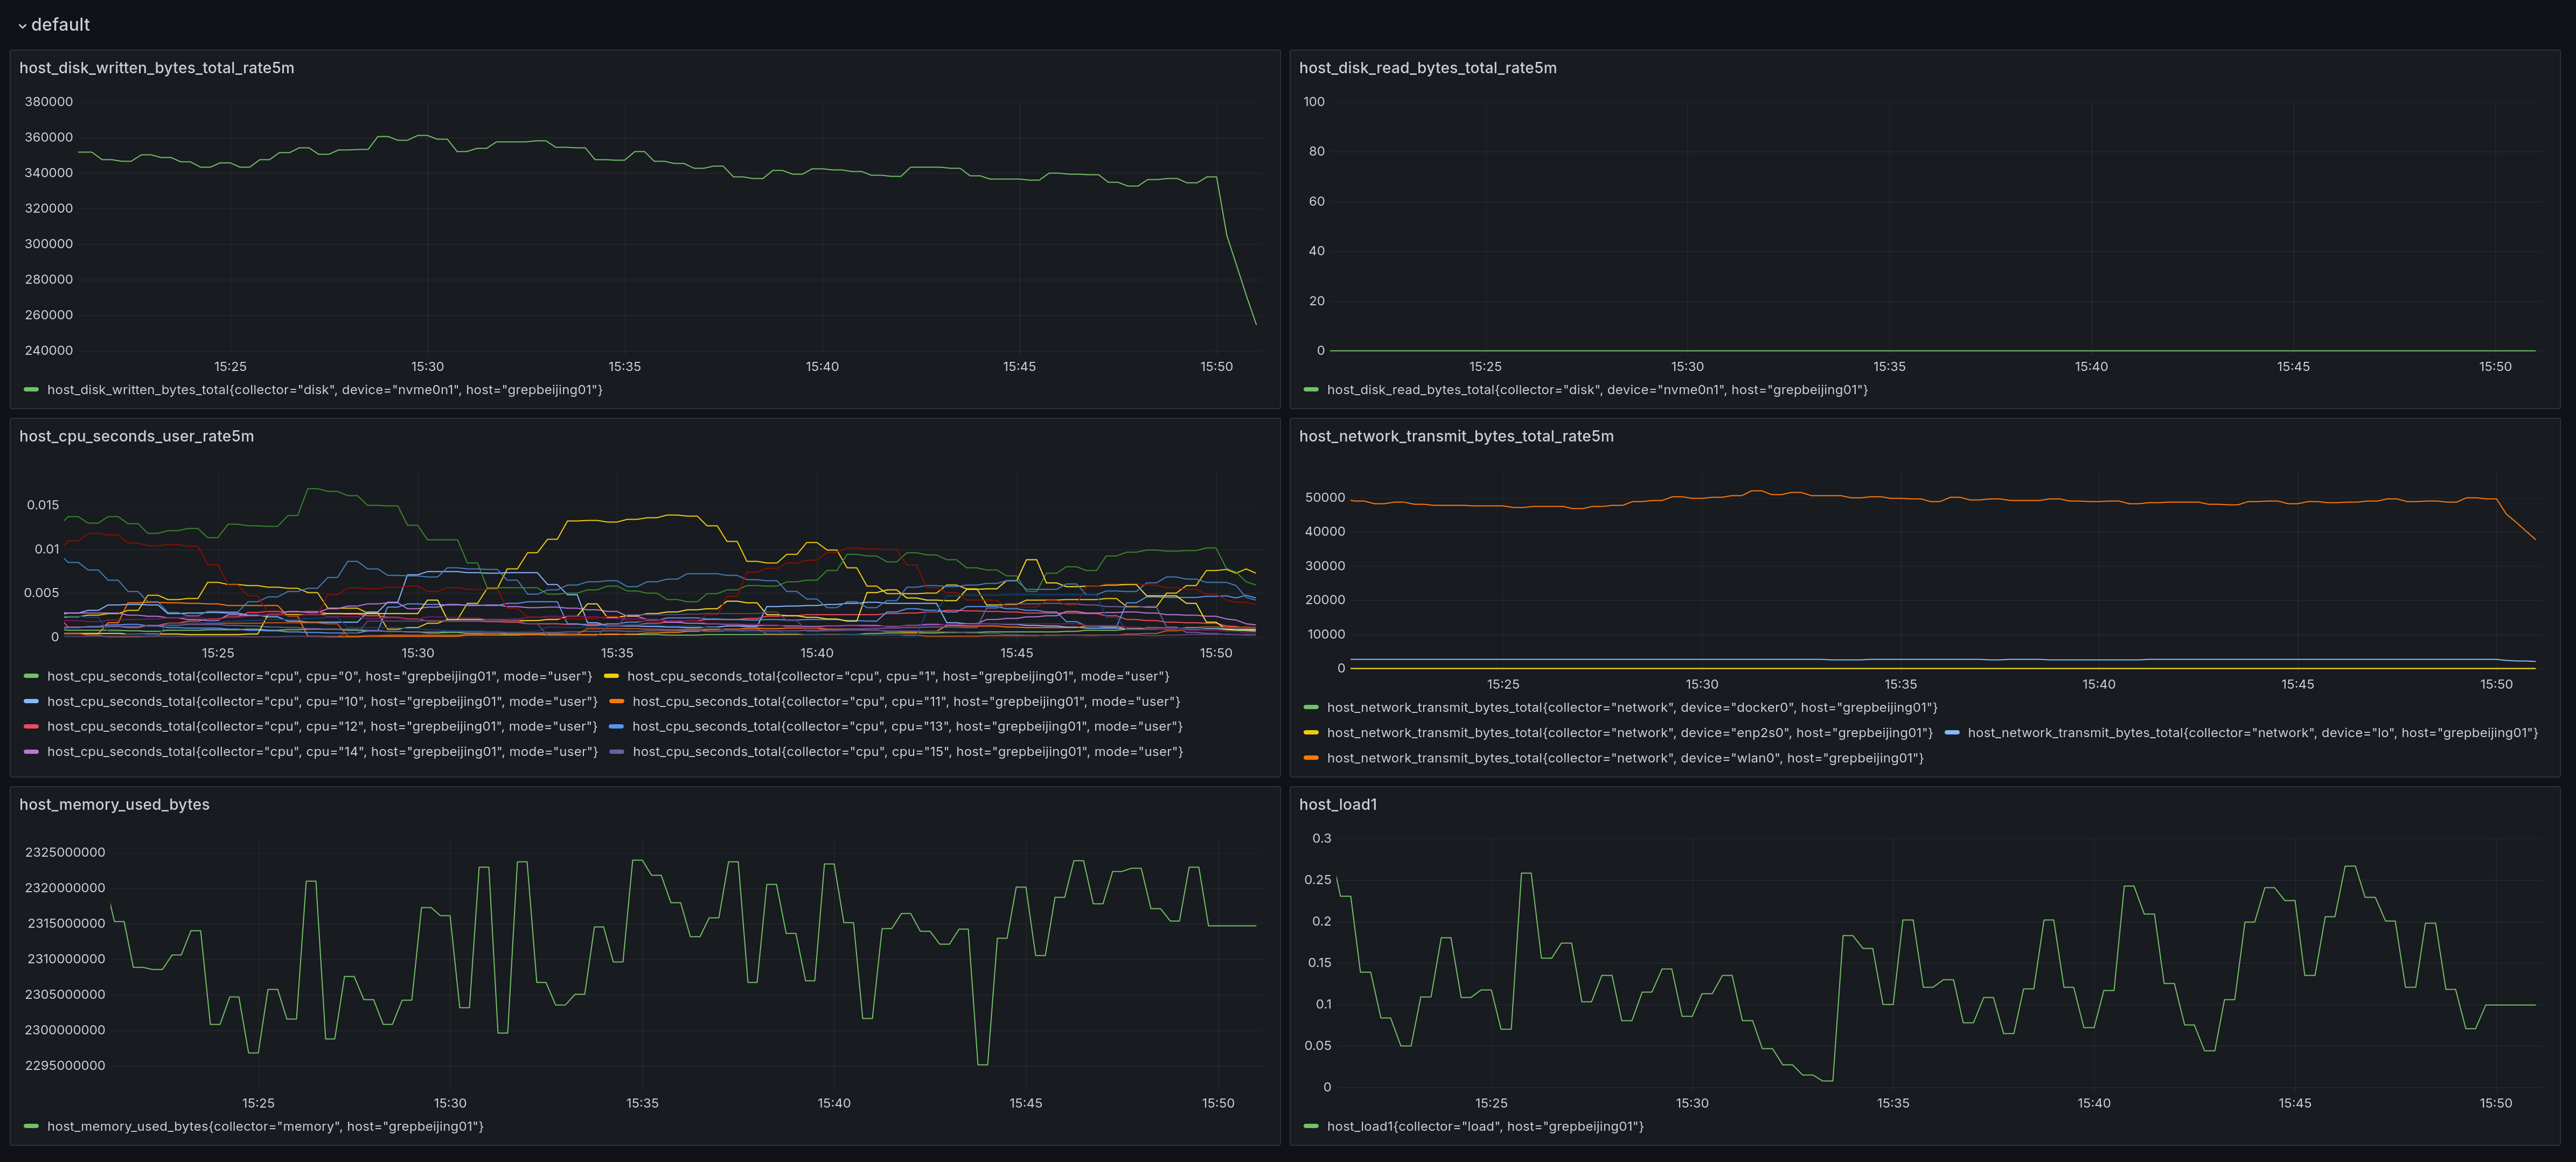
Time-series data rendered with GreptimeDB data source.
Grab the latest release from release page, Unzip the file to your grafana plugin directory.
You can also use grafana cli to download and install
grafana cli --pluginUrl https://github.com/GreptimeTeam/greptimedb-grafana-datasource/releases/latest/download/info8fcc-greptimedb-datasource.zip plugins install info8fcc
Note that you may need to restart your grafana server after installing the plugin.
We also build Grafana docker image that ships GreptimeDB data source by default. To get the docker image, run
docker pull greptime/grafana-greptimedb:latest
docker run -p 3000:3000 greptime/grafana-greptimedb:latest
See our setup guide from our docs.
We started this plugin from forking Grafana's built-in Prometheus plugin. The goal of this plugin is to provide visualization support for all native types of GreptimeDB data.
- Time series panels
- PromQL
- GreptimeDB's additional field selector
- SQL
- Time macro
- PromQL
- Event UI
- Event
- Settings UI
- DB name input
- Authentication
Yarn 1.x is required for this project. Execute these commands in code root folder
-
Install dependencies
yarn install
-
Build plugin in development mode and run in watch mode
yarn run dev
-
Build backend plugin binaries for Linux, Windows and Darwin:
mage -v build:linux
-
Start Docker Service
docker compose up
Join our community slack channel #grafana for discussion of this plugin.
GreptimeDB uses the Apache License 2.0 to strike a balance between open contributions and allowing you to use the software however you want.


