Once an installation is complete, access the Kubecost frontend to view the status of the product. If the Kubecost UI is unavailable, review these troubleshooting resources to determine the problem:
These kubernetes commands can be helpful when finding issues with deployments:
-
This command will find all events that aren't normal, with the most recent listed last. Use this if pods are not even starting:
kubectl get events --sort-by=.metadata.creationTimestamp --field-selector type!=Normal -
If a pod is in CrashLoopBackOff, check its logs. Commonly it will be a misconfiguration in helm. If the cost-analyzer pod is the issue, check the logs with:
kubectl logs deployment/kubecost-cost-analyzer -c cost-model
-
Alternatively, Lens is a great tool for diagnosing many issues in a single view. See our blog post on using Lens with Kubecost
Your clusters need a default storage class for the Kubecost and Prometheus persistent volumes to be successfully attached.
To check if a storage class exists, you can run
kubectl get storageclass
You should see a storageclass name with (default) next to it as in this example.
NAME                PROVISIONER           AGE
standard (default)  kubernetes.io/gce-pd  10d
If you see a name but no (default) next to it, run
kubectl patch storageclass <name> -p '{"metadata": {"annotations":{"storageclass.kubernetes.io/is-default-class":"true"}}}'
If you don’t see a name, you need to add a storage class. For help doing this, see the following guides:
- AWS: https://docs.aws.amazon.com/eks/latest/userguide/storage-classes.html
- Azure: https://kubernetes.io/docs/concepts/storage/storage-classes/#azure-disk
Alternatively, you can deploy Kubecost without persistent storage to store by following these steps:
Note: This setup is only for experimental purpose. The metric data is reset when kubecost's pod is rescheduled.
- On your terminal, run this command to add the kubecost helm repository:
helm repo add kubecost https://kubecost.github.io/cost-analyzer/
- Next, run this command to deploy Kubecost without persistent storage:
helm upgrade -install kubecost kubecost/cost-analyzer \
--namespace kubecost --create-namespace \
--set persistentVolume.enabled="false" \
--set prometheus.server.persistentVolume.enabled="false"
First, check the status of pods in the target namespace:
kubectl get pods -n kubecost
You should see the following pods running
NAME                                                     READY   STATUS    RESTARTS   AGE
kubecost-cost-analyzer-599bf995d4-rq8g8                  2/2     Running   0          5m
kubecost-grafana-5cdd75755b-5s9j9                        1/1     Running   0          5m
kubecost-prometheus-kube-state-metrics-bd985f98b-bl8xd   1/1     Running   0          5m
kubecost-prometheus-node-exporter-24b8x                  1/1     Running   0          5m
kubecost-prometheus-server-6fb8f99bb7-4tjwn              2/2     Running   0          5m
If the cost-analyzer or prometheus-server pods are missing, we recommend reinstalling with Helm using --debug which enables verbose output.
If any pod is not Running other than cost-analyzer-checks, you can use the following command to find errors in the recent event log:
kubectl describe pod <pod-name> -n kubecost
If there is an existing node-exporter daemonset, the Kubecost Helm chart may timeout due to a conflict. You can disable the installation of node-exporter by passing the following parameters to the Helm install.
helm install kubecost/cost-analyzer --debug --wait --namespace kubecost --name kubecost \
    --set kubecostToken="<INSERT_YOUR_TOKEN>" \
    --set prometheus.nodeExporter.enabled=false \
--set prometheus.serviceAccounts.nodeExporter.create=falseYou may encounter the following screen if the Kubecost frontend is unable to connect with a live Kubecost server.
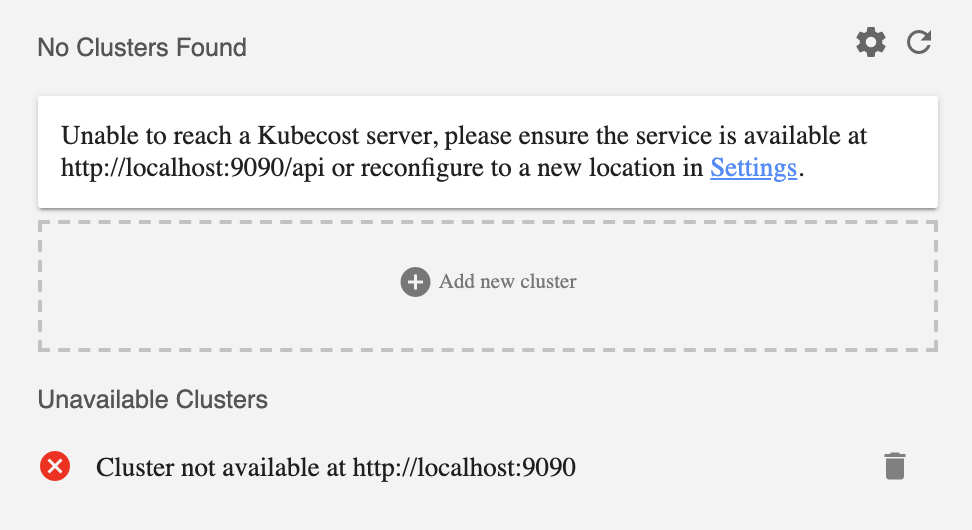
Recommended troubleshooting steps are as follows:
If you are using a port other than 9090 for your port-forward, try adding the url with port to the "Add new cluster" dialog.
Next, you can review messages in your browser's developer console. Any meaningful errors or warnings may indicate an unexpected response from the Kubecost server.
Next, point your browser to the /model endpoint on your target URL. For example, visit http://localhost:9090/model/ in the scenario shown above. You should expect to see a Prometheus config file at this endpoint. If your cluster address has changed, you can visit Settings in the Kubecost product to update or you can also add a new cluster.
If you are unable to successfully retrieve your config file from this /model endpoint, we recommend the following:
- Check your network connection to this host
- View the status of all Prometheus and Kubecost pods in this cluster's deployment to determine if any container are not in a
ReadyorCompletedstate. When performing the default Kubecost install this can be completed withkubectl get pods -n kubecost. All pods should be either Running or Completed. You can runkubectl describeon any pods not currently in this state. - Finally, view pod logs for any pod that is not in the Running or Completed state to find a specific error message.
Please contact us at [email protected] or on Slack at any point with questions.
If all Kubecost pods are running and you can connect / port-forward to the kubecost-cost-analyzer pod but none of the app's UI will load, we recommend testing the following:
- Connect directly to a backend service with the following command:
kubectl port-forward --namespace kubecost service/kubecost-cost-analyzer 9001 - Ensure that
http://localhost:9001returns the prometheus YAML file
If this is true, you are likely to be hitting a CoreDNS routing issue. We recommend using local routing as a solution:
- Go to https://github.com/kubecost/cost-analyzer-helm-chart/blob/master/cost-analyzer/templates/cost-analyzer-frontend-config-map-template.yaml#L13
- Replace
{{ $serviceName }}.{{ .Release.Namespace }}withlocalhost
Note: this question only applies when installing Kubecost via helm 2
The core Kubecost product needs read-only permissions.
Many teams deploy helm Tiller with cluster-admin privileges to install and manage applications across different namespaces. More information on managing these permissions at https://v2.helm.sh/docs/rbac/
- Edit nginx configmap
kubectl edit cm nginx-conf -n kubecost - Search for 9001 and 9003 (should find kubecost-cost-analyzer.kubecost:9001 & kubecost-cost-analyzer.kubecost:9003)
- Change both entries to localhost:9001 and localhost:9003
- Restart the kubecost-cost-analyzer pod in the kubecost namespace
Kubecost makes use of cloud provider metadata servers to access instance and cluster metadata. If a restrictive network policy is place this may need to be modified to allow connections from the kubecost pod or namespace.
Error example:
gcpprovider.go Error loading metadata cluster-name: Get "http://169.254.169.254/computeMetadata/v1/instance/attributes/cluster-name": dial tcp 169.254.169.254:80: i/o timeout
Have a question not answered on this page? Email us at [email protected] or join the Kubecost Slack community!
Edit this doc on GitHub