Below are the major components deployed with the Kubecost helm chart, excluding certain Enterprise components such as durable storage:
- Kubecost Cost-Analyzer Pod
a. Frontend -- runs Nginx and handles routing to Kubecost backend + Prometheus/Grafana
b. Kubecost server -- backend for API calls
c. Cost-model -- provides cost allocation calculations and metrics, both reads and writes to Prometheus - Prometheus
a. Prometheus server -- time-series data store for cost & health metrics
b. Kube-state-metrics -- provides Kubernetes API metrics, e.g. resource requests
c. Node-exporter -- provides node-level utilization metrics for right-sizing recommendations and cluster utilization
d. Pushgateway -- provides the ability for users to push new metrics to Prometheus [Optional]
e. Alertmanager -- used for custom alerts [Optional] - Network costs -- optional DaemonSet for collecting network metrics learn more
- Grafana -- provides supporting dashboards for Kubecost product [Optional]
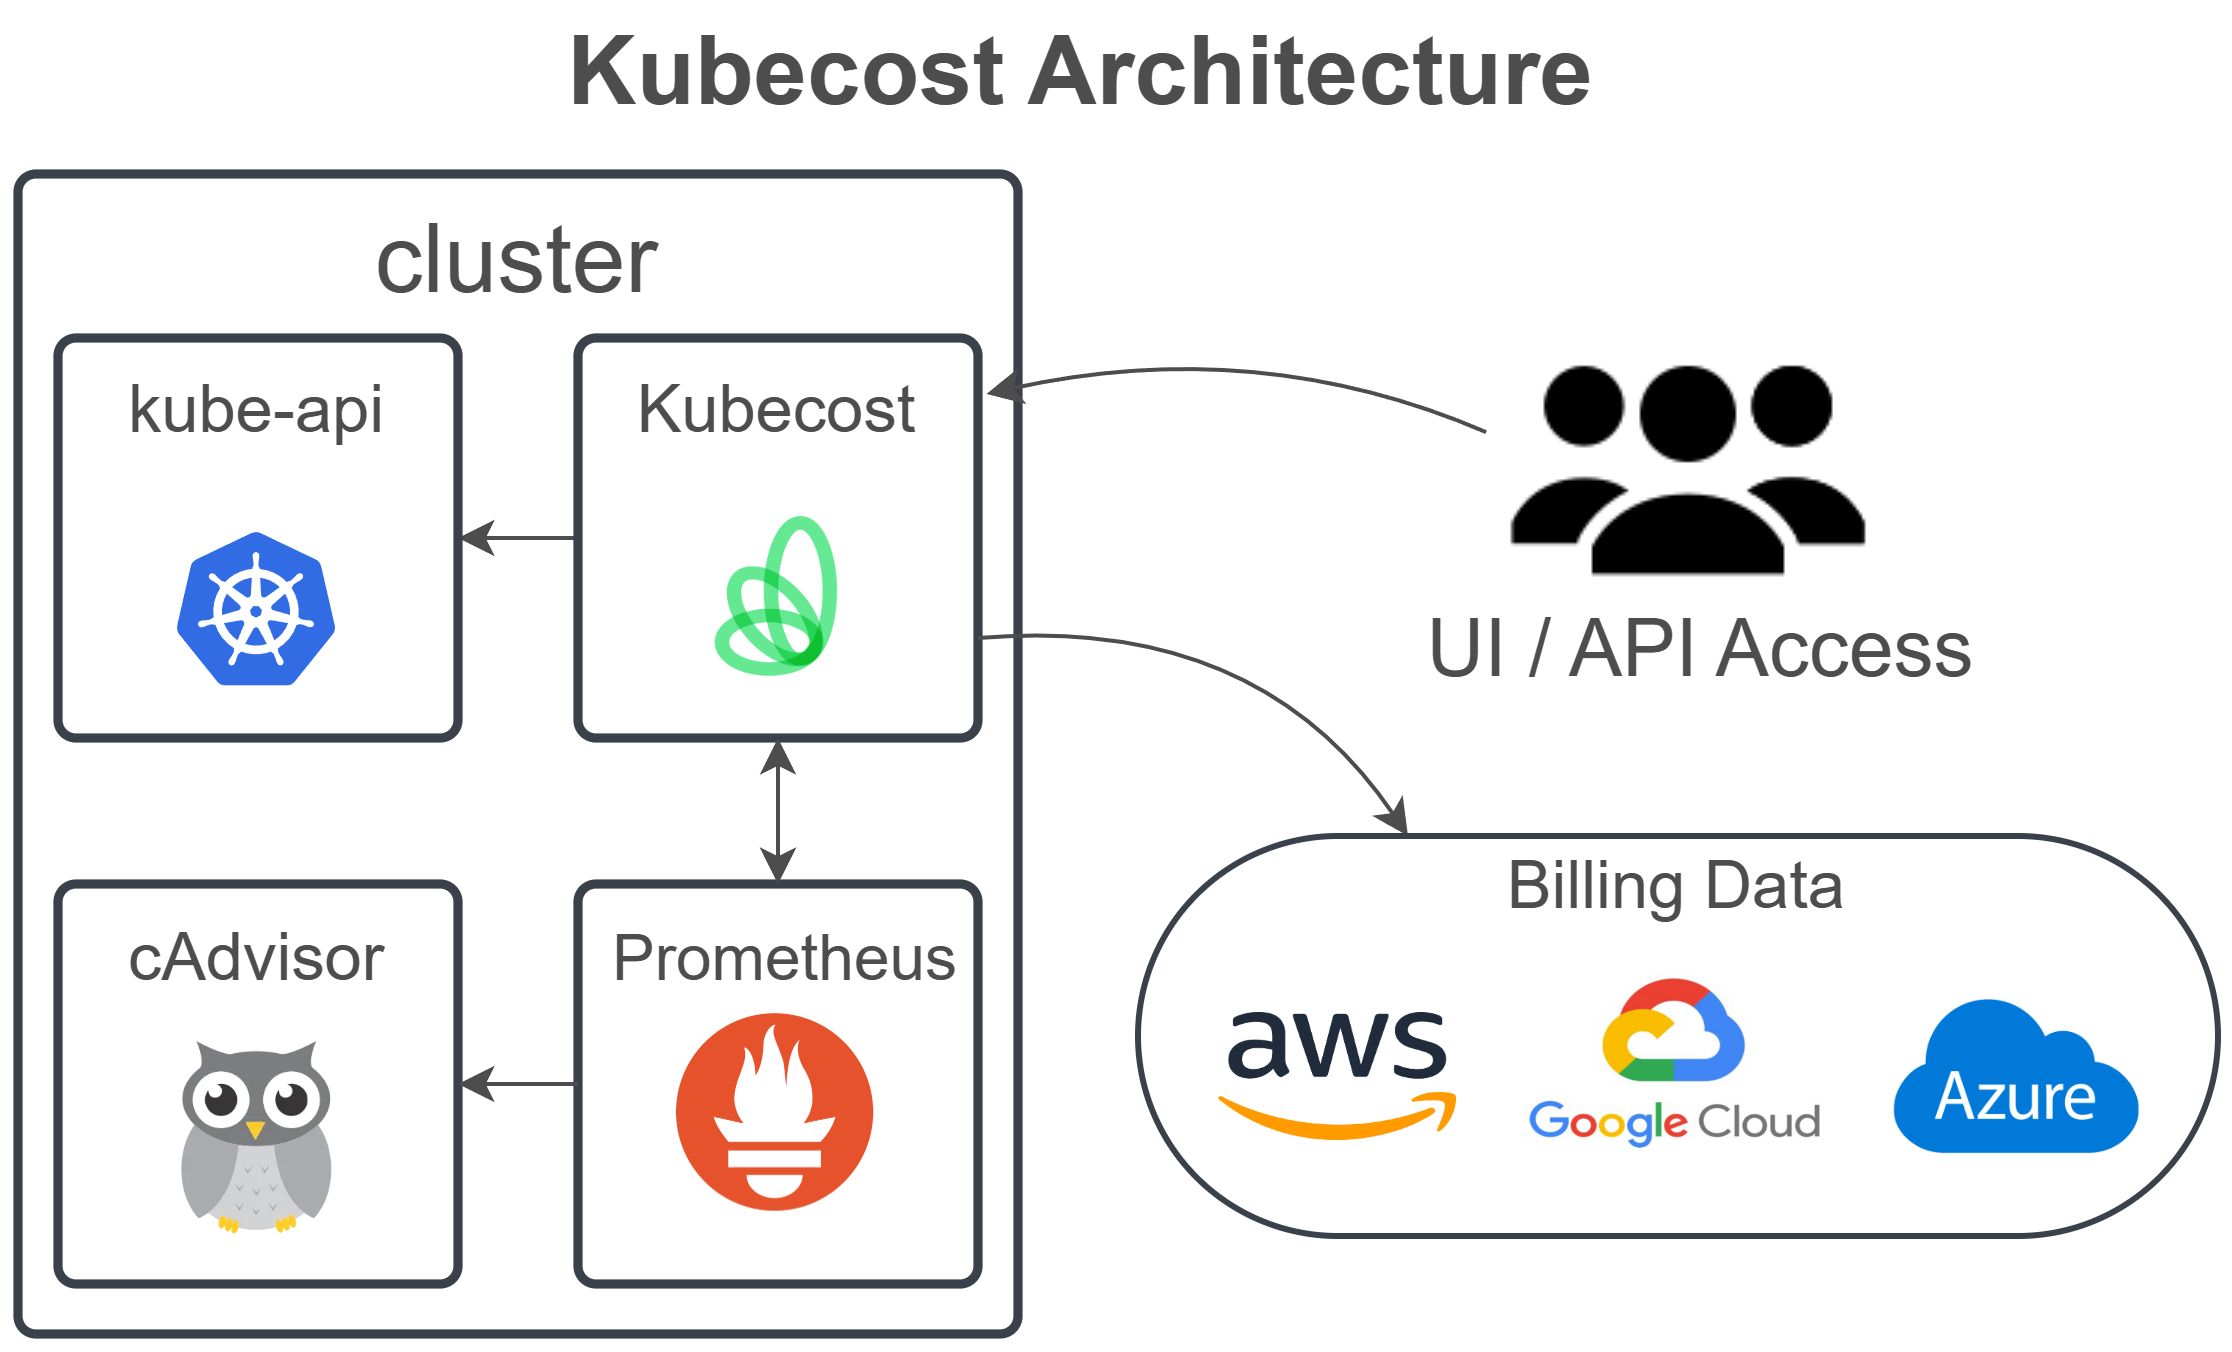
Today, the core Kubecost product can be run with just components 1, 2a, 2b, and 2c.
See an overview of core components in this diagram:
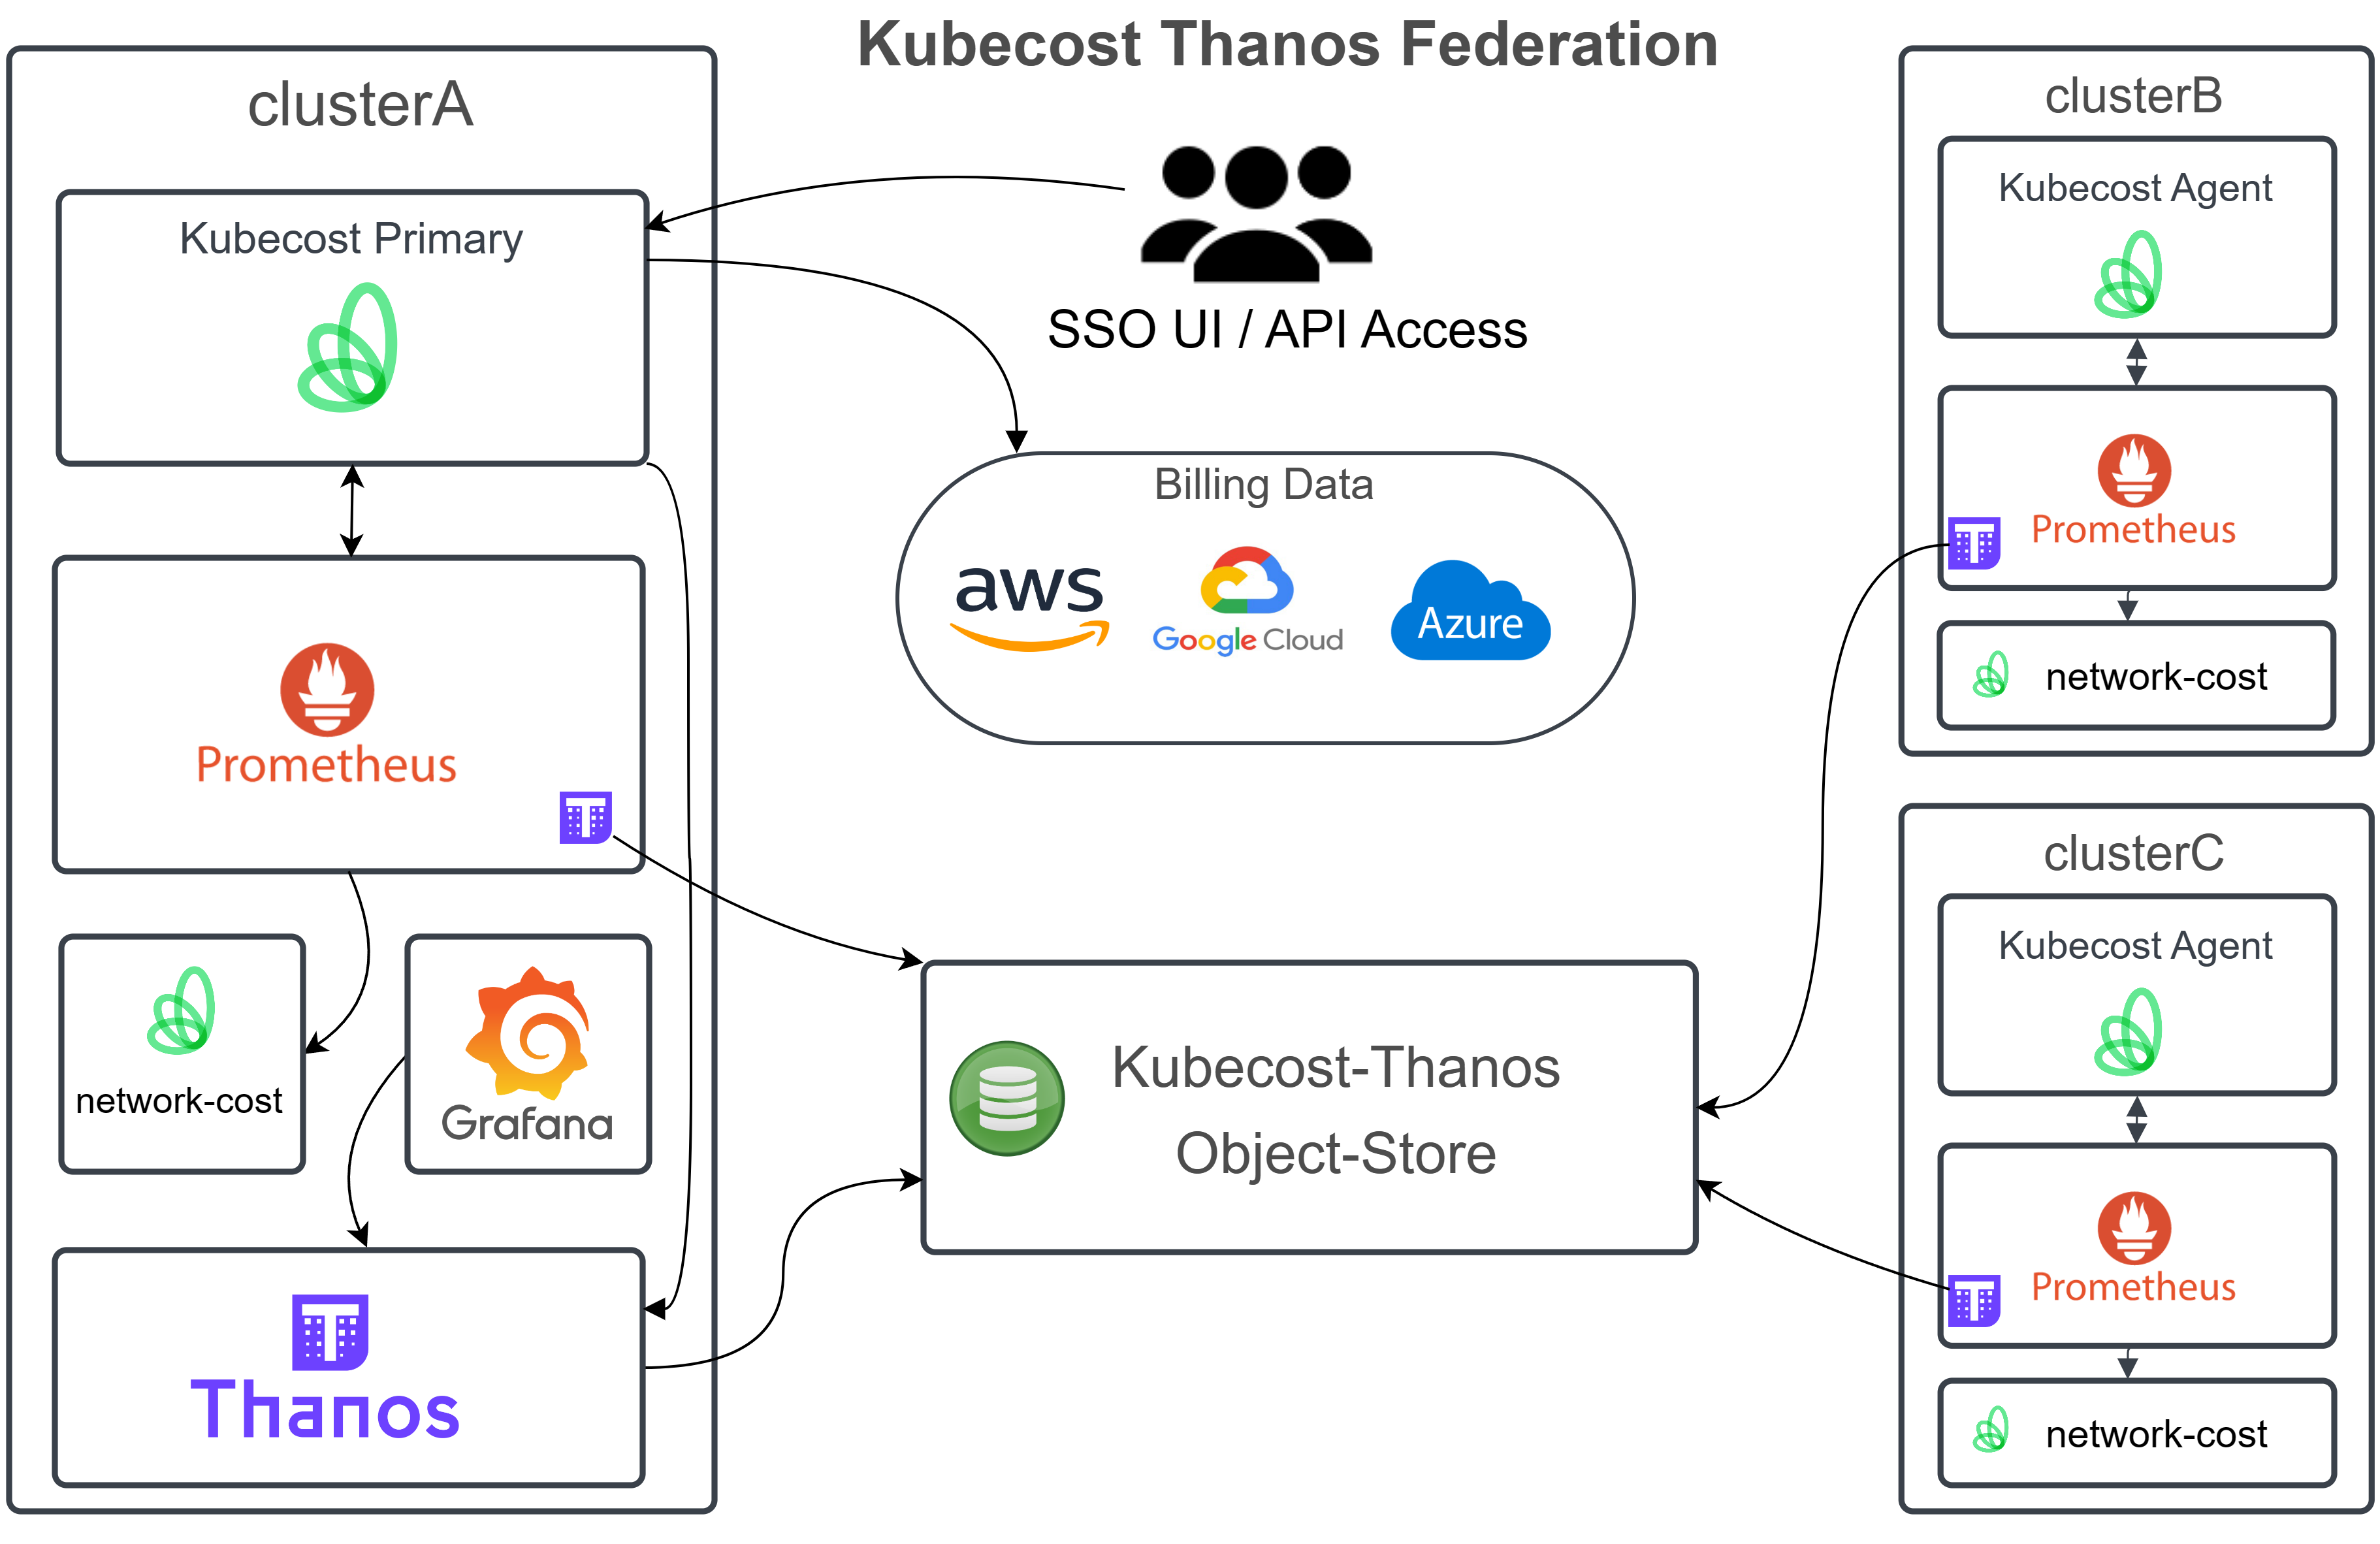
The most common implementation of durable storage in the Kubecost application is with Thanos. Below is a high-level reference for the required components. More information on each Thanos component can be found here.
Edit this doc on GitHub