Kubecost alerts allow teams to receive updates on real-time Kubernetes spend. They are configurable via the Kubecost UI or Helm values. This resource gives an overview of how to configure Kubecost email and Slack alerts using Kubecost helm chart values. The following alert types are supported:
-
Recurring update - sends an email and/or Slack alert with cluster spend across all or a subset of kubernetes resources.
-
Budget -- sends an email and/or Slack alert when spend crosses a defined threshold
-
Spend Change -- sends an email and/or Slack alert reporting unexpected spend increases relative to moving averages
-
[Beta] Efficiency -- detect when a Kubernetes tenant is operating below a target cost-efficiency threshold
-
Kubecost Health Diagnostic -- used for production monitoring for the health of Kubecost itself
-
Cluster Health -- used to determine if the cluster's health score changes by a specific threshold.
Have questions or issues? View our troubleshooting guide.
Note: values.yaml is a source of truth. Alerts set through values.yaml will continually overwrite any manual alert settings set through the Kubecost UI.
The alert settings, under global.notifications.alertConfigs in cost-analyzer/values.yaml, accept four global fields:
frontendUrloptional, your cost analyzer front end URL used for linkbacks in alert bodiesglobalSlackWebhookUrloptional, a global Slack webhook used for alerts, enabled by default if providedglobalAlertEmailsa global list of emails for alerts
Example Helm values.yaml:
notifications:
    # Kubecost alerting configuration
    alertConfigs:
      frontendUrl: http://localhost:9090
      globalSlackWebhookUrl: https://hooks.slack.com/services/T00000000/B00000000/XXXXXXXXXXXXXXXXXXXXXXXX
      globalAlertEmails:
        - [email protected]
        - [email protected]
      # Alerts generated by kubecost, about cluster data
      alerts:
      # list of individual alerts
# ...In addition to globalSlackWebhookUrl and globalAlertEmails fields, every alert allows optional individual ownerContact (a list of email addresses) and slackWebhookUrl (if different from globalSlackWebhookUrl) fields. Alerts will default to the global Slack and email settings if these optional fields are not supplied.
Sends a recurring email and/or Slack alert with a summary report of cost and efficiency metrics.
Required parameters:
type: recurringUpdateaggregation: <aggregation>filter: '*'window: <N>d
Valid Window Parameters:
<N>dwhereN in [1, 7)for every N days7dorweeklyfor 0:00:00 UTC every Monday30dormonthlyfor 0:00:00 UTC on the first day of the month.
Valid Aggregation Parameters:
clustercontainercontrollernamespacepodservicedeploymentdaemonsetstatefulsetjoblabelrequires the following format:label:<label_name>annotationrequires the following format:annotation:<annotation_name>
Required parameters (by individual namespace):
type: recurringUpdateaggregation: namespacefilter: <value>-- configurable, accepts a single namespace name (comma-separated values unsupported)window: 7d
Example Helm values.yaml:
# Recurring weekly namespace update on all namespaces
- type: recurringUpdate
  window: weekly  # or 7d
  aggregation: namespace
  filter: '*'
# Recurring weekly namespace update on kubecost namespace
- type: recurringUpdate
  window: weekly  # or 7d
  aggregation: namespace
  filter: kubecost
  ownerContact: # optional, overrides globalAlertEmails default
    - [email protected]
    - [email protected]
  slackWebhookUrl: https://hooks.slack.com/services/<different-from-global> # optional, overrides globalSlackWebhookUrl default
Note: this feature is currently in Beta
Alert when Kubernetes tenants, e.g. namespaces or label sets, are running below defined cost-efficiency thresholds.
Required parameters:
type: efficiencyefficiencyThreshold: <threshold>-- efficiency threshold ranging from 0.0 to 1.0aggregation: <agg-parameter>-- configurable, accepts all aggregations supported by the aggregated cost model APIwindow: <N>dnumber of days for measuring efficiency
Optional parameters:
filter: <value>-- limit the aggregations that this alert will cover, accepts comma-separated valuesspendThresholdrepresents a minimum spend threshold for alerting
The example below sends a Slack alert when any namespace spending is running below 40% cost efficiency and has spent more than $100 during the last day.
- type: efficiency
  efficiencyThreshold: 0.4  # Alert if below this percentage cost efficiency
  spendThreshold: 100 # optional, alert if tenant has spend more than $100 over this window
  window: 1d    # measure efficiency over last
  aggregation: namespace
  slackWebhookUrl: ‘https://hooks.slack.com/services/TE6GRBNET/BFFK0P848/jFWmsadgfjhiBJp30p’ # optional, overrides global Slack webhook
Define spend budgets and alert on budget overruns.
Required parameters:
type: budgetthreshold: <amount>-- cost threshold in configured currency unitsaggregation: <agg-parameter>-- configurable, accepts all aggregations supported by the aggregated cost model APIfilter: <value>-- configurable, accepts a single filter value (comma-separated values unsupported)window: <N>dor<M>h-- configurable, (1 ≤ N ≤ 7, 1 ≤ M ≤ 24)
Example Helm values.yaml:
# Daily namespace budget alert on namespace `kubecost`
- type: budget
  threshold: 50
  window: daily # or 1d
  aggregation: namespace
  filter: kubecost
# 3d cluster budget alert on cluster `cluster-one`
- type: budget
  threshold: 600
  window: 3d
  aggregation: cluster
  filter: cluster-one
Detect unexpected spend increases/decreases relative to historical moving averages.
Required parameters:
type: spendChangerelativeThreshold: <N>-- configurable, N ≥ -1aggregation: <agg-value>-- configurable, accepts all aggregations supported by the aggregated cost model APIwindow: <N>dor<M>h-- configurable, (1 ≤ N ≤ 7, 1 ≤ M ≤ 24)baselineWindow: <N>d-- configurable, N ≥ 1
Optional parameters:
filter: <value>-- limit the aggregations that this alert will cover, accepts comma-separated values
Example Helm values.yaml:
# Daily spend change alert on the
- type: spendChange
  relativeThreshold: 0.20   # change relative to baseline average cost. Must be greater than -1 (can be negative).
  window: 1d                # accepts ‘d’, ‘h’
  baselineWindow: 30d       # previous window, offset by window
  aggregation: namespace
  filter: kubecost, default # accepts csv
Enabling diagnostic alerts in Kubecost occur when an event impacts product uptime. This feature can be enabled in seconds from a values file. The following events are grouped into distinct categories that each result in a separate alert notification:
- Prometheus is unreachable
- Kubecost Metrics Availability:
- Kubecost exported metrics missing over last 5 minutes
- cAdvisor exported metrics missing over last 5 minutes
- cAdvisor exported metrics missing expected labels in the last 5 minutes
- Kubestate Metrics (KSM) exported metrics missing over last 5 minutes
- Kubestate Metrics (KSM) unexpected version
- Node Exporter metrics are missing over last 5 minutes.
- Scrape Interval prometheus self-scraped metrics missing over last 5 minutes
- CPU Throttling detected on cost-model in the last 10 minutes
- Clusters Added/Removed (Enterprise Multicluster Support Only)
Required parameters:
type: diagnosticwindow: <N>m-- configurable, N > 0
Optional parameters:
diagnostics-- object containing specific diagnostic checks to run (default istruefor all). See configuration example below for options:
This alert only uses Slack (email coming soon), so it requires the globalSlackWebhookUrl field, or setting the slackWebhookUrl field for the alert.
Example Helm values.yaml:
# Kubecost Health Diagnostic
- type: diagnostic
  window: 10m
  diagnostics:
    prometheusUp: true
    cAdvisor: true
    ksm: true
    kubecost: true
    nodeExporter: true
    scrapeInterval: true
    cpuThrottling: true
    clusterJoinLeave: true
Cluster health alerts occur when the cluster health score changes by a specific threshold. The health score is calculated based on the following criteria:
- Low Cluster Memory
- Low Cluster CPU
- Too Many Pods
- Crash Looping Pods
- Out of Memory Pods
- Failed Jobs
This alert only uses Slack (email coming soon), so it requires the globalSlackWebhookUrl field, or setting the slackWebhookUrl field for the alert.
Example Helm values.yaml:
# Health Score Alert
- type: health              # Alerts when health score changes by a threshold
  window: 10m
  threshold: 5              # Send Alert if health scores changes by 5 or more
Cluster Health Alerts and Diagnostic Alerts work differently from other alert types. While other alerts monitor cost data for cost or efficiency anomalies, Health and Diagnostics montior the health of Kubecost itself, as well as the health of the cluster running Kubecost. The UI treats these alert types as "on" or "off", managing a single instance of each, and allowing the settings of this single instance to be adjusted.
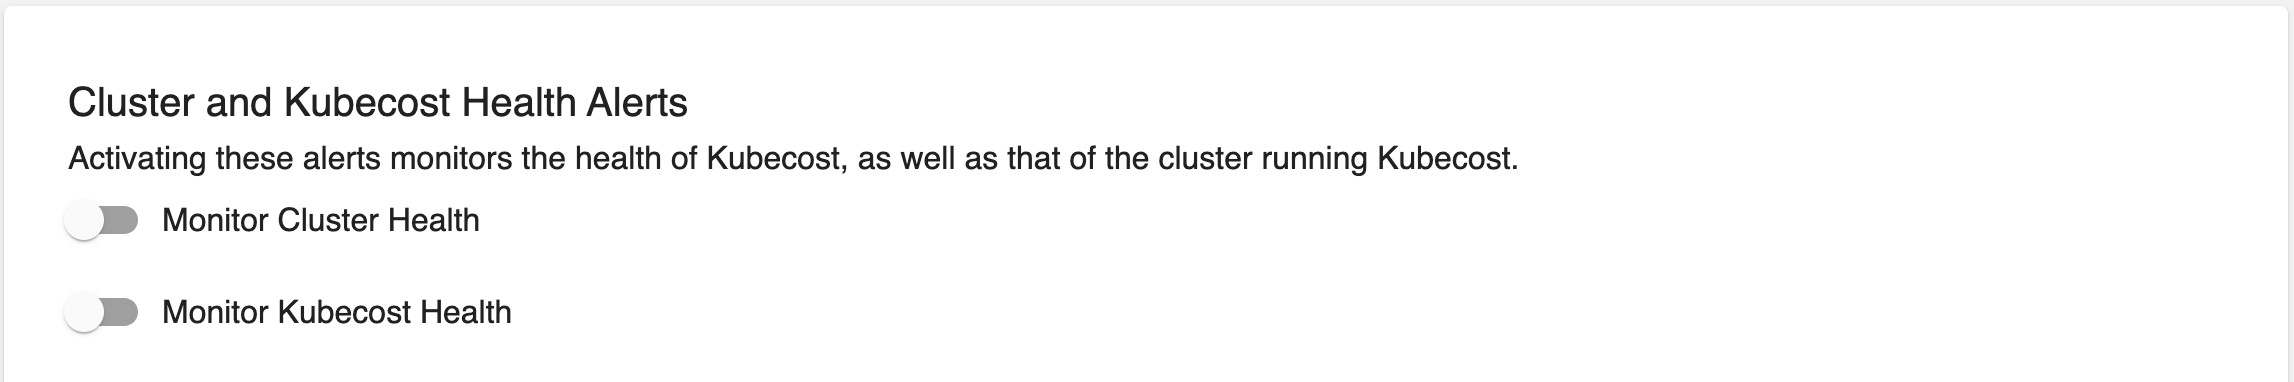
NOTE: As of this writing, there is no validation around Cluster Health Alerts. If a Health Alert configuration is invalid, it will appear to save, but will not actually take effect. Please check carefully that the alert has a Window and Threshold properly specified.
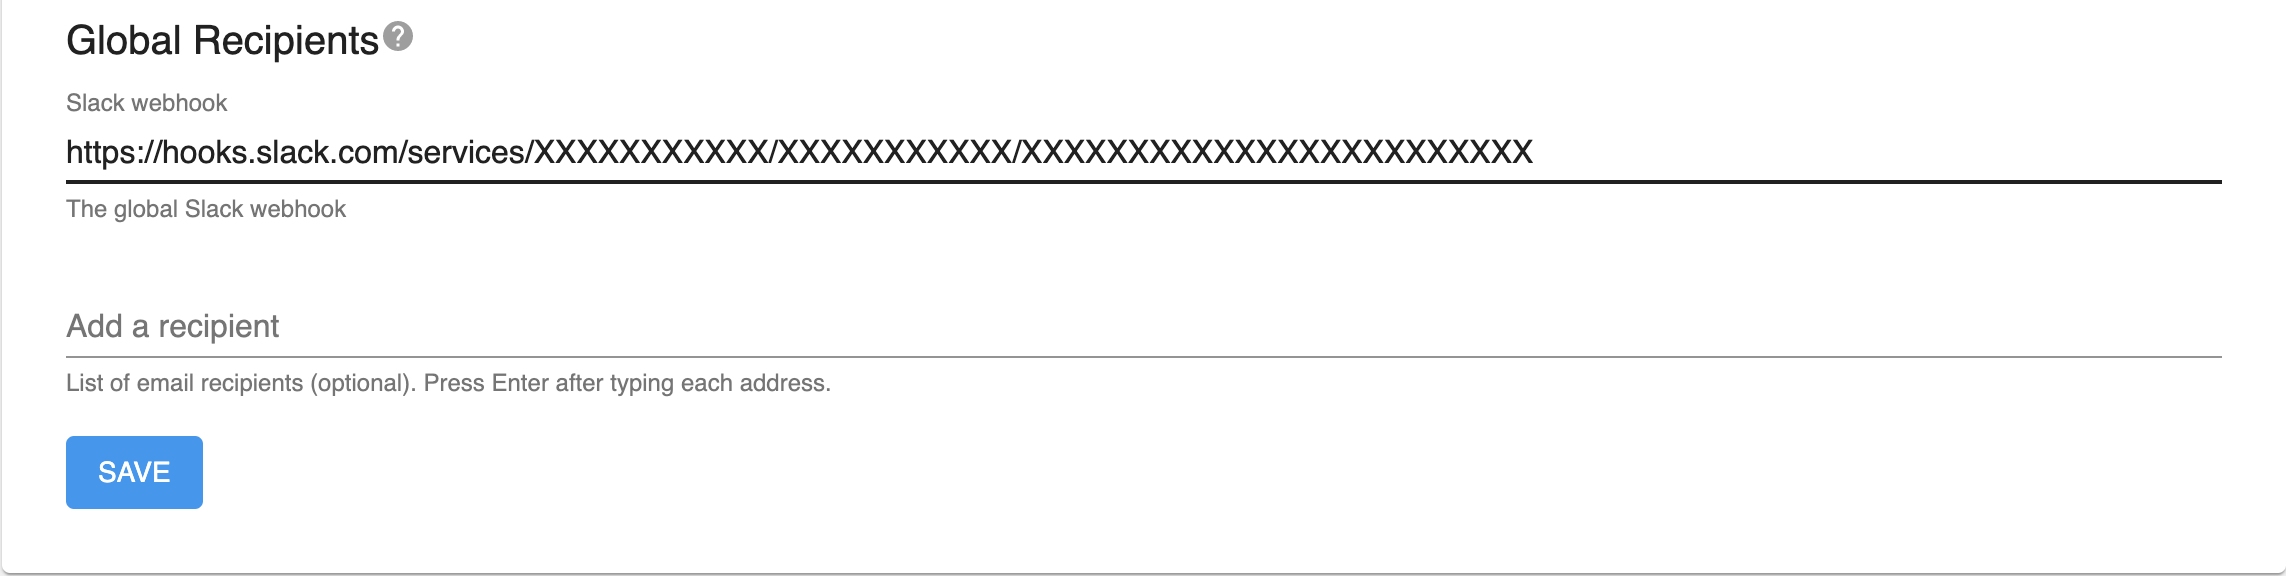
Global recipients specify a default fallback recipient for each type of message. If an alert does not define any email recipients, its messages will be sent to any emails specified in the Global Recipients email list. Likewise, if an alert does not define a Slack webhook, its messages will be sent to the Global Slack webhook, it one is present. Alerts that do define recipients will ignore the global setting for recipients of that type.
The remaining Alert types share some commonality: they all target a set of Cost Allocation data with window, aggregation and filter parameters, and trigger based on the target data. The table results can be filtered using the "Filter alerts" input at the top-right of the table. This input can be used to filter based on alert type, aggregation, window, and/or filter.
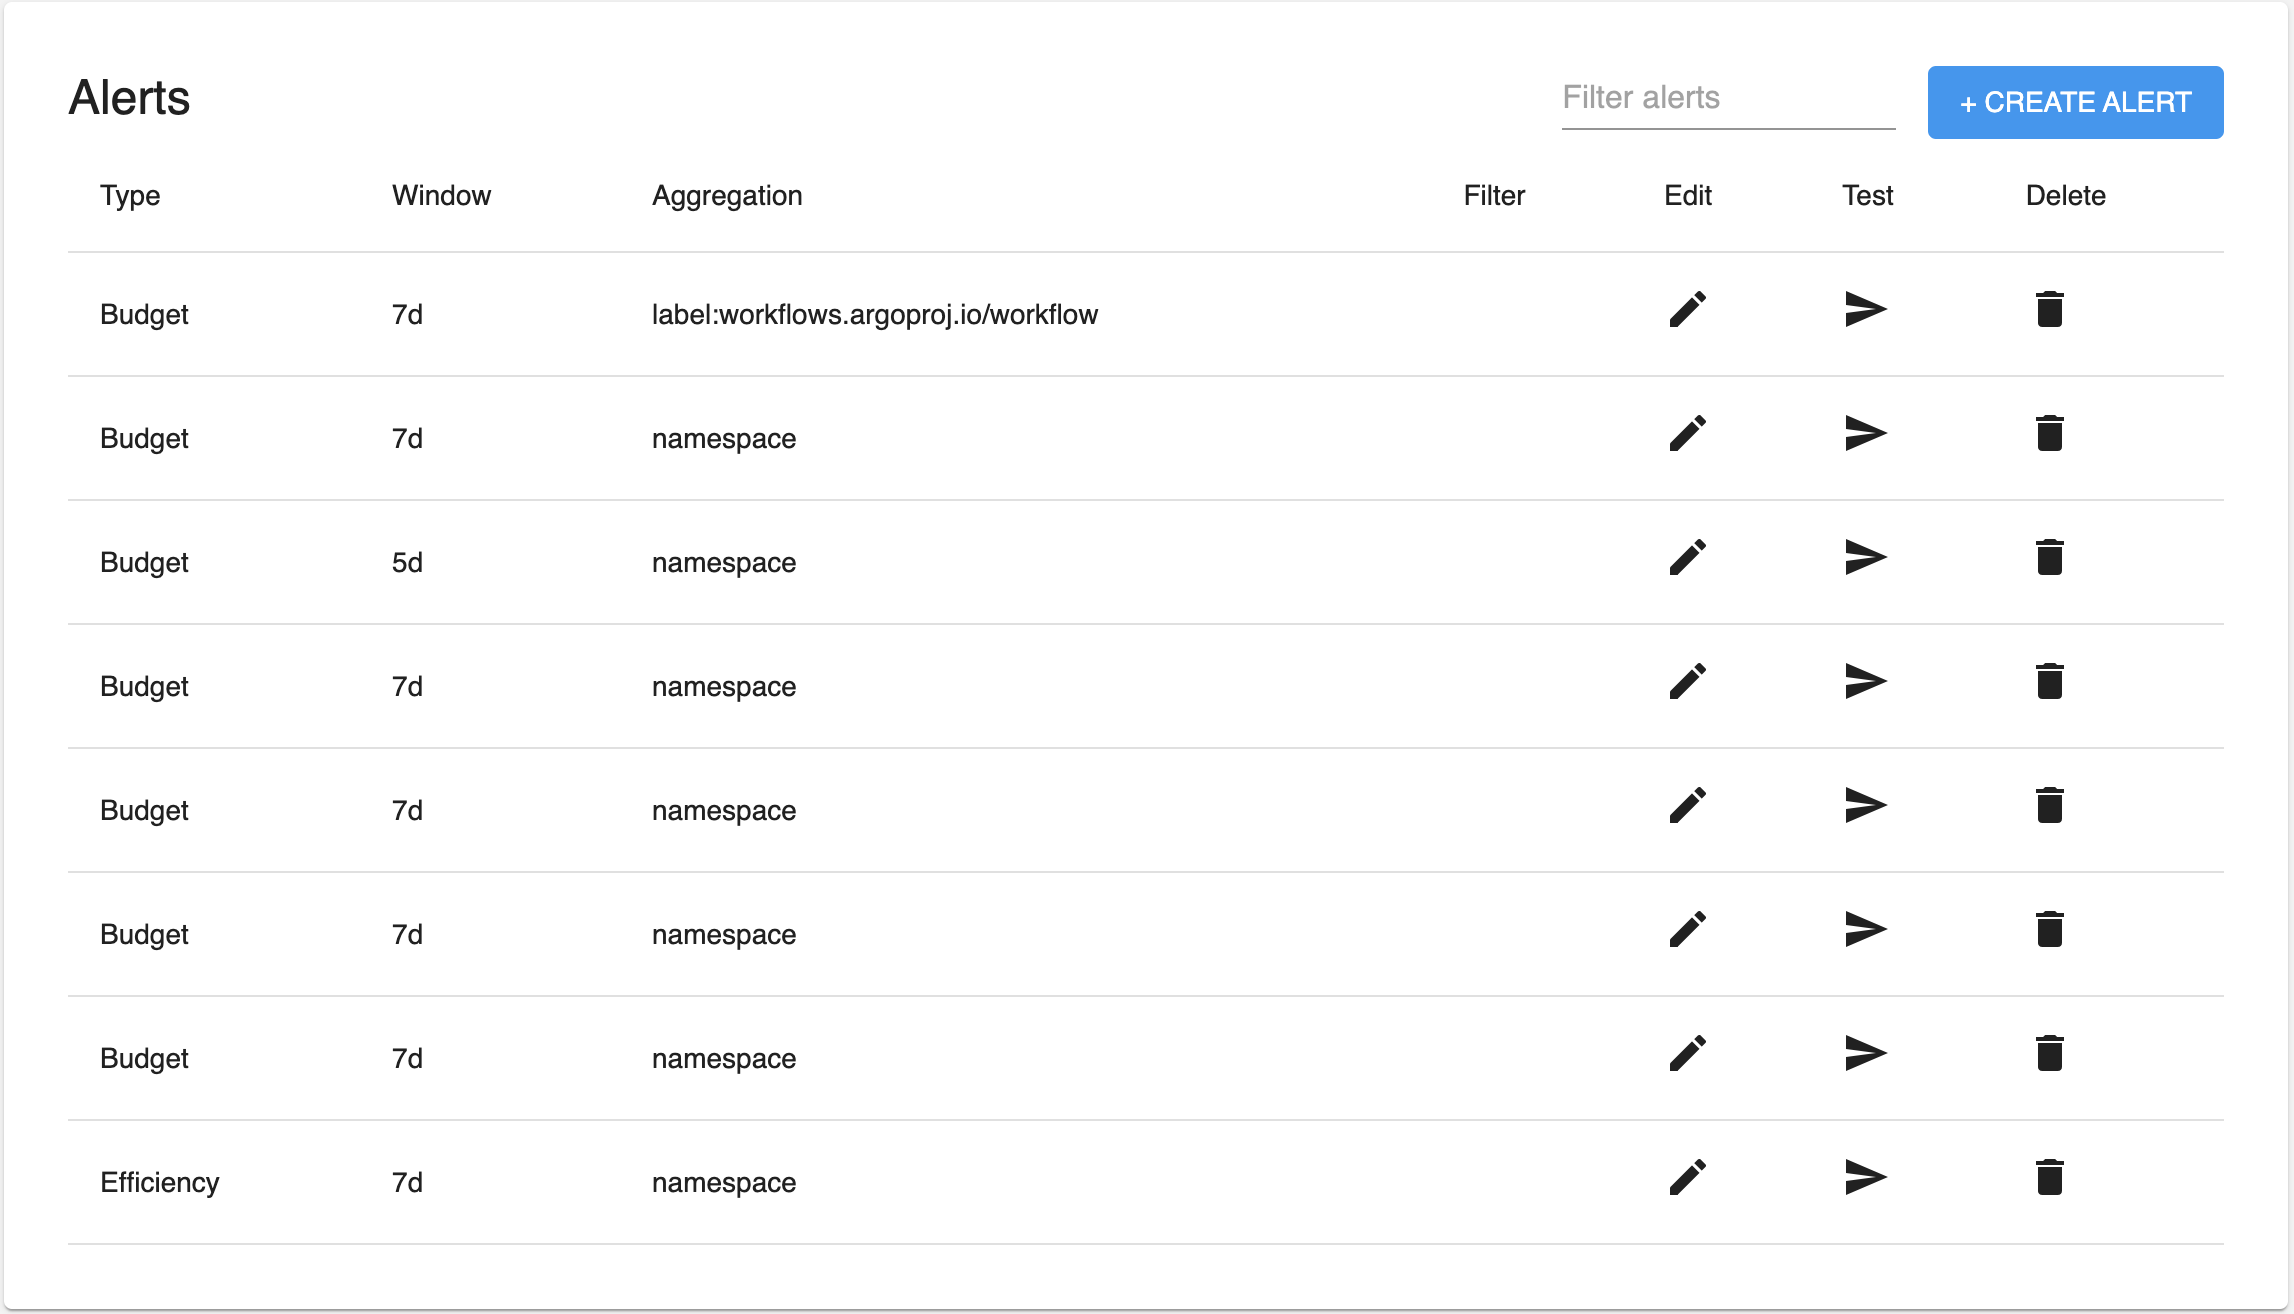
The + Create Alert button summons a dialog to walk through the creation of a new alert.
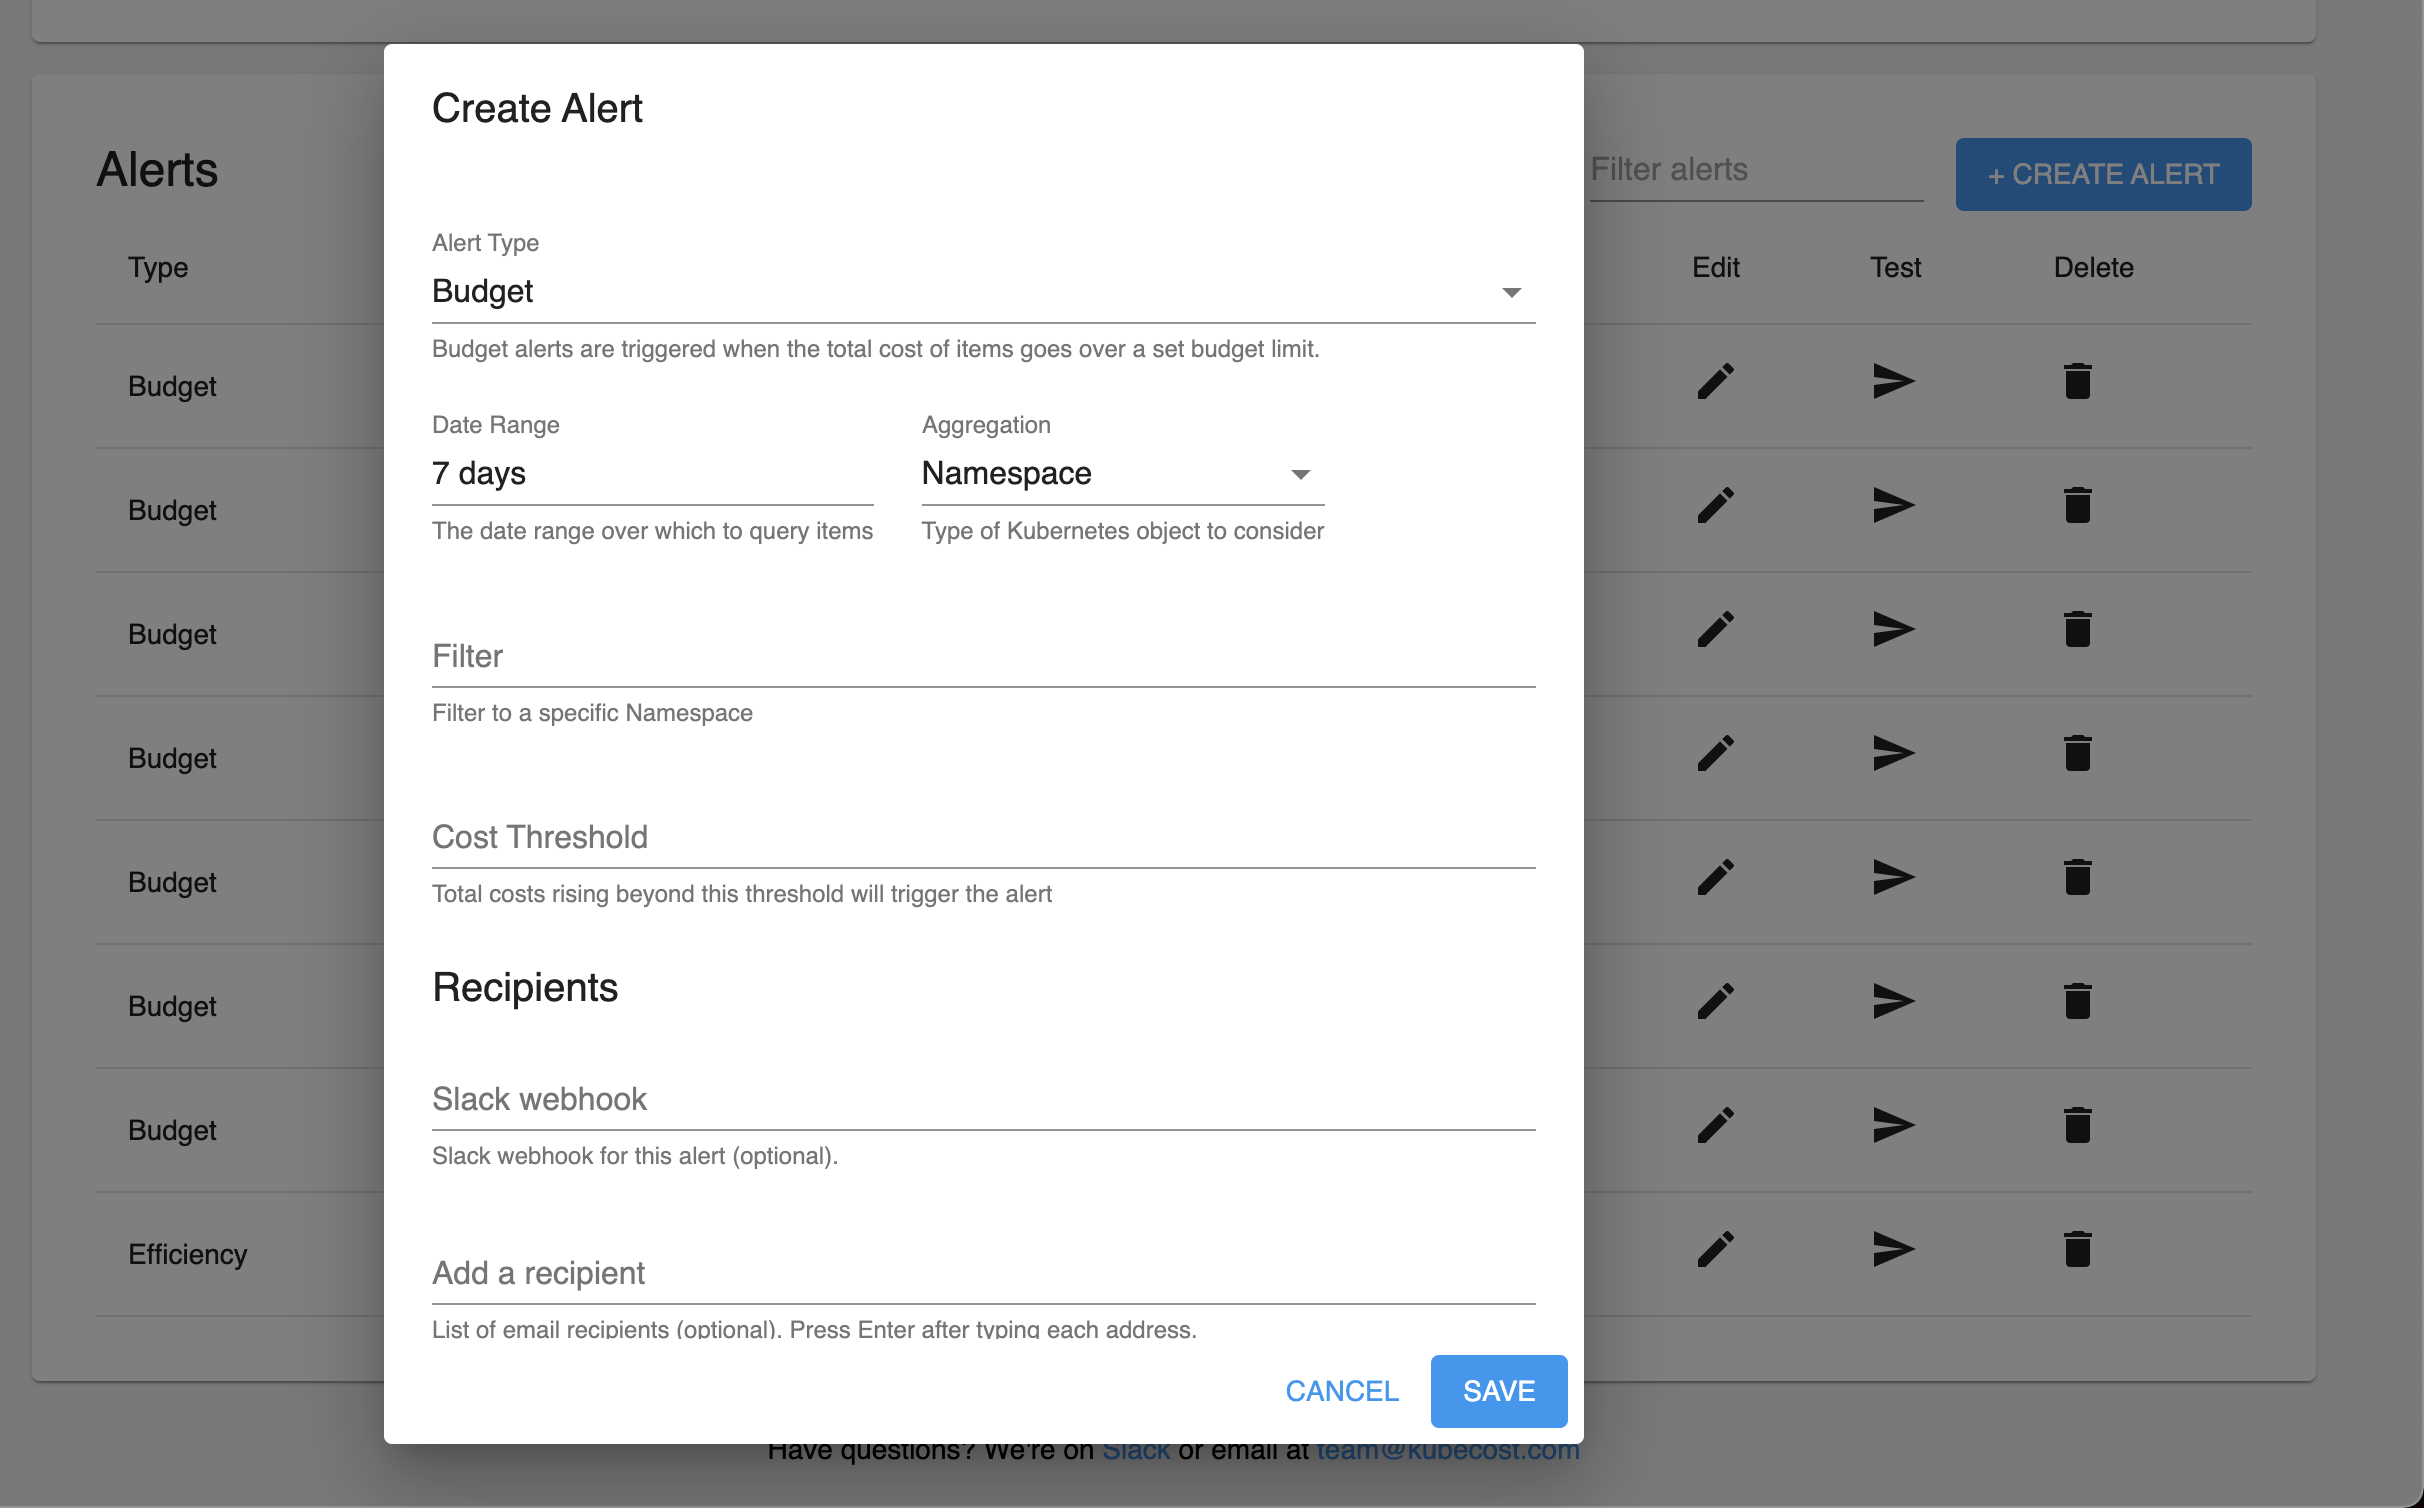
Alerts can also be edited, removed, and tested from the table. Editing opens a dialog similar to the alert creation dialog, for editing the chosen alert.
The Test buttons in the Table, the Create / Edit dialogs, and beside enabled Health and Diagnostics alerts, can be used to issue a "test" alert. This can be useful to ensure that alerting infrastructure is working correctly and that an alert is properly configured. Issuing a test from the alert edit modal tests the alert with any modifications that have not yet been saved.
All times in UTC. Alert send times are determined by parsing the supplied window parameter. Alert diagnostics with next and last scheduled run times are available via <your-kubecost-url>/model/alerts/status.
Supported: weekly and daily special cases, <N>d, <M>h (1 ≤ N ≤ 7, 1 ≤ M ≤ 24)
Currently Unsupported: time zone adjustments, windows greater than 7d, windows less than 1h
An <N>d alert sends at 00:00 UTC N day(s) from now, i.e., N days from now rounded down to midnight.
For example, a
5dalert scheduled on Monday will send on Saturday at 00:00, and subsequently the next Thursday at 00:00
An <N>h alert sends at the earliest time of day after now that is a multiple of N.
For example, a
6halert scheduled at any time between 12 pm and 6 pm will send next at 6 pm and subsequently at 12 am the next day.
If 24 is not divisible by the hourly window, schedule at next multiple of <N>h after now, starting from the current day at 00:00.
For example, a
7halert scheduled at 22:00 checks 00:00, 7:00, 14:00, and 21:00, before arriving at the next send time of 4:00 tomorrow.
Review these steps to verify alerts are being passed to the Kubecost application correctly.
General Steps:
- Check
/model/alerts/configsto ensure the alerts system has been configured properly. - Check
/model/alerts/statusto ensure alerts have been scheduled correctly.- The status endpoint returns all of the running alerts including schedule metadata:
scheduledOn: The date and time (UTC) that the alert was scheduled.lastRun: The date and time (UTC) that the alert last ran checks (will be set to0001-01-01T00:00:00Zif the alert has never run).nextRun: The date and time (UTC) that the alert will next run checks.lastError: If running the alert checks fails for unexpected reasons, this field will contain the error message.
- The status endpoint returns all of the running alerts including schedule metadata:
If Using Helm:
- Run
kubectl get configmap alert-configs -n kubecost -o jsonto view alerts configmap. - Ensure that the Helm values are successfully read into the configmap under alerts.json under the
datafield. - Example:
{
    "apiVersion": "v1",
    "data": {
        "alerts.json": "{\"globalAlertEmails\":[\"[email protected]\",\"[email protected]\"],\"frontendUrl\":\"http://localhost:3000\",\"globalSlackWebhookUrl\":\"\",\"alerts\":[{\"type\":\"budget\",\"threshold\":50,\"window\":\"1d\",\"aggregation\":\"namespace\",\"filter\":\"kubecost\"},{\"type\":\"spendChange\",\"relativeThreshold\":0.2,\"window\":\"1d\",\"baselineWindow\":\"30d\",\"aggregation\":\"namespace\",\"filter\":\"kubecost, default\"},{\"type\":\"budget\",\"threshold\":202.1,\"window\":\"1d\",\"aggregation\":\"cluster\",\"filter\":\"cluster-one\"},{\"type\":\"recurringUpdate\",\"window\":\"7d\",\"aggregation\":\"namespace\",\"filter\":\"*\"}]}\n"
    },
    "kind": "ConfigMap",
    "metadata": {
        "creationTimestamp": "2022-01-05T23:43:27Z",
		"labels": {
            "app": "cost-analyzer",
            "app.kubernetes.io/instance": "kubecost-stage",
            "app.kubernetes.io/managed-by": "Helm",
	    ...
        },
        "name": "alert-configs",
        "namespace": "kubecost",
    ...
    }
}
- Ensure that the json string is successfully mapped to the appropriate configs
Confirm that Kubecost product has received configuration data:
- Go to
<your-kubecost-url>/alerts.htmlin the Kubecost UI to view configured email and Slack settings as well as any of the alerts configured from Helm.- Note that alerts setup via the UI will be overwritten by Helm
values.yamlif the pod restarts.
- Note that alerts setup via the UI will be overwritten by Helm
Additionally, confirm that the alerts scheduler has properly parsed and scheduled a next run for each alert by visiting <your-kubecost-url>/model/alerts/status to view individual alert parameters as well as next and last scheduled run times for individual alerts.
- Confirm that
nextRunhas been updated from "0001-01-01T00:00:00Z"
If nextRun fails to update, or alerts are not sending at the nextRun time, check pod logs by running kubectl logs $(kubectl get pods -n kubecost | awk '{print $1}' | grep "^kubecost-cost-analyzer.\{16\}") -n kubecost -c cost-model > kubecost-logs.txt
- Common causes of misconfiguration include the following:
- unsupported csv filters --
spendChangealerts acceptfilteras comma-separated values; other alert types do not. - unsupported alert type -- all alert type names are in camelCase -- check spelling and capitalization for all alert parameters
- unsupported aggregation parameters -- see the aggregated cost model API for details
- unsupported csv filters --
Have questions? Join our Slack community or contact us via email at [email protected]!
Edit this doc on GitHub