When integrating Kubecost with an existing Prometheus, we recommend first installing Kubecost with a bundled Prometheus (instructions) as a dry run before integrating with an external Prometheus deployment. You can get in touch ([email protected]) or via our Slack community for assistance.
Note: integrating with an existing Prometheus is only officially supported under Kubecost paid plans.
Kubecost requires the following minimum versions:
- kube-state-metrics - v1.6.0+ (May 19)
- cAdvisor - kubelet v1.11.0+ (May 18)
- node-exporter - v0.16+ (May 18) [Optional]
-
Pass the following parameters in your helm values file:
prometheus.fqdnto match your local Prometheus service address with this formathttp://<prometheus-server-service-name>.<prometheus-server-namespace>.svcprometheus.enabledset tofalse
Pass this updated file to the Kubecost helm install command with
--values values.yaml -
Have your Prometheus scrape the cost-model
/metricsendpoint. These metrics are needed for reporting accurate pricing data. Here is an example scrape config:
- job_name: kubecost
      honor_labels: true
      scrape_interval: 1m
      scrape_timeout: 10s
      metrics_path: /metrics
      scheme: http
      dns_sd_configs:
      - names:
        - kubecost-cost-analyzer.<namespace-of-your-kubecost>
        type: 'A'
        port: 9003
This config needs to be added under extraScrapeConfigs in the Prometheus configuration. View Example
To confirm this job is successfully scraped by Prometheus, you can view the Targets page in Prometheus and look for a job named kubecost.

NOTE: There is no need to add additional recording rules starting in v1.90.0. This section will be removed soon!
Kubecost uses Prometheus recording rules to enable certain product features and to help improve product performance. These are recommended additions, especially for medium and large-sized clusters using their own Prometheus installation. You can find the current set of recording rules used in the rules block under prometheus.server.serverFiles in this values.yaml file.
Note: Kubecost recording rules were most recently updated in v1.65.0.
Note that this step is optional, and only impacts certain efficiency metrics. View issue/556 for a description of what will be missing if this step is skipped.
You'll need to add the following relabel config to the job that scrapes the node exporter DaemonSet.
  - job_name: 'kubernetes-service-endpoints'

    kubernetes_sd_configs:
      - role: endpoints

    relabel_configs:
      - source_labels: [__meta_kubernetes_pod_node_name]
        action: replace
        target_label: kubernetes_node
Note that this does not override the source label-- it creates a new label called "kubernetes_node" and copies the value of pod into it.
Visiting <your-kubecost-endpoint>/diagnostics.html provides diagnostics info on this integration. More details
Common issues include the following:
- Wrong Prometheus FQDN: evidenced by the following pod error message
No valid prometheus config file at ...and the init pods hanging. We recommend runningcurl <your_prometheus_url>/api/v1/status/configfrom a pod in the cluster to confirm that your Prometheus config is returned. Here is an example, but this needs to be updated based on your Prometheus address:
kubectl exec kubecost-cost-analyzer-db55d88f6-fr6kc -c cost-analyzer-frontend -n kubecost \
-- curl http://kubecost-prometheus-server.kubecost/api/v1/status/config
If the config file is not returned, this is an indication that an incorrect Prometheus address has been provided. If a config file is returned from one pod in the cluster but not the Kubecost pod, then the Kubecost pod likely has its access restricted by a network policy, service mesh, etc.
-
Prometheus throttling -- ensure Prometheus isn't being CPU throttled due to a low resource request.
-
Wrong dependency version -- see the section above about Requirements
-
Missing scrape configs -- visit Prometheus Target page (screenshot above)
-
Data incorrectly is a single namespace -- make sure that honor_labels is enabled
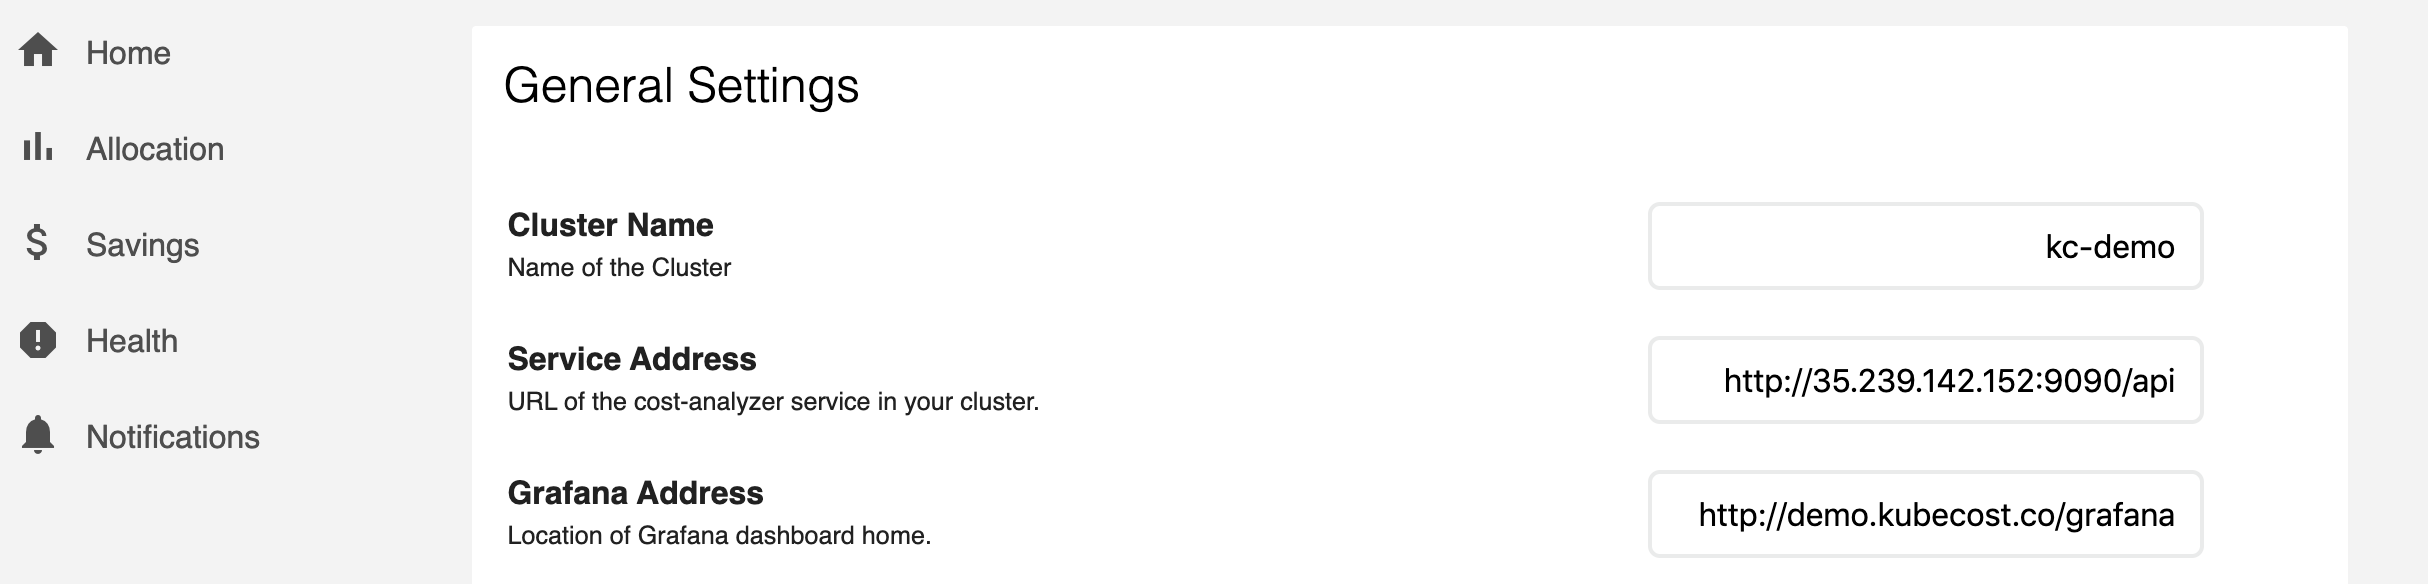
You can visit Settings in Kubecost to see basic diagnostic information on these Prometheus metrics:

Using an existing Grafana deployment can be accomplished with either of the following two options:
- Option: Directly link to an external Grafana. After Kubecost installation, visit Settings and update Grafana Address to a URL (e.g. http://demo.kubecost.com/grafana) that is visible to users accessing Grafana dashboards. This variable can alternatively be passed at the time you deploy Kubecost via the
kubecostProductConfigs.grafanaURLparameter in values.yaml. Next, import Kubecost Grafana dashboards as JSON from this folder.
- Option: Deploy with Grafana sidecar enabled. Passing the Grafana parameters below in your values.yaml will install ConfigMaps for Grafana dashboards that will be picked up by the Grafana sidecar if you have Grafana with the dashboard sidecar already installed.
global:
  grafana:
    enabled: false
    domainName: cost-analyzer-grafana.default #example where format is <service-name>.<namespace>
    proxy: false
grafana:
  sidecar:
    dashboards:
      enabled: true
    datasources:
      enabled: false
For Option 2, ensure that the following flags are set in your Operator deployment:
- sidecar.dashboards.enabled = true
- sidecar.dashboards.searchNamespace isn't restrictive, use
ALLif Kubecost runs in another namespace.
Edit this doc on Github